Shenzhen Pengsheng MicroVision Tech Co., Ltd.


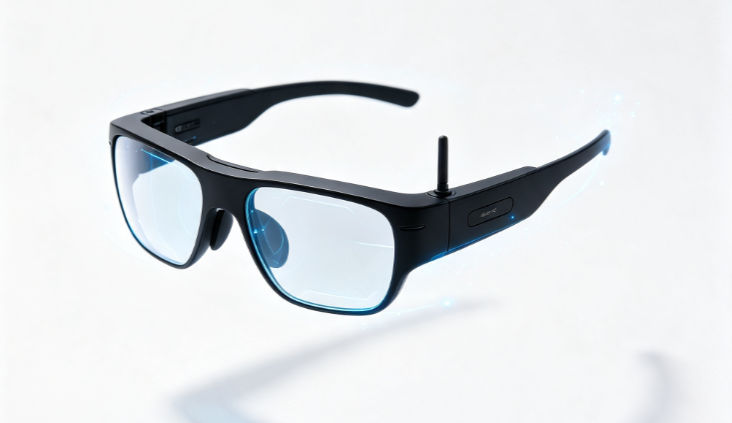

In the research and development pipeline for spatial computing and near-eye displays (NEDs), even the subtle compromise of a single optical parameter can dictate the commercial success or failure of a product [1].
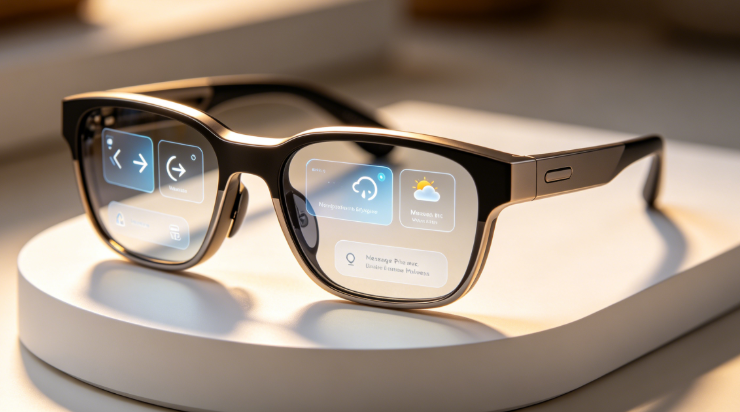
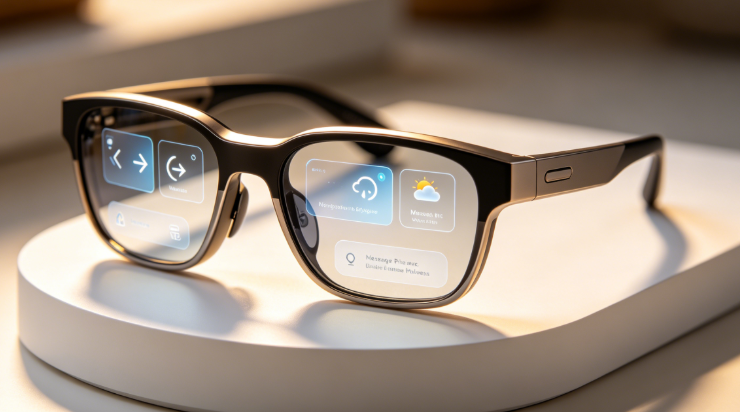
Unlike traditional flat-panel displays found in smartphones or televisions, a near-eye display system pairs a microdisplay panel (light engine) with complex optical architectures to project a high-precision virtual image at a comfortable accommodation distance for the human eye [2].
As Dr. Bernard Kress, former SPIE President and former Principal Optical Architect for Microsoft HoloLens, emphasized in his seminal text Optical Architectures for Augmented, Virtual, and Mixed Reality Headsets:
“In spatial computing, the display is no longer a passive glass screen. It is an active optical mesh that must seamlessly trick the human visual system. Achieving 60 PPD alongside low motion-to-photon latency is not merely a performance preference—it is the non-negotiable biological threshold of human visual perception.” [3]
This technical whitepaper provides an exhaustive breakdown of core near-eye display parameters, including Field of View (FOV), Pixels Per Degree (PPD), Eyebox, Luminance, and systemic optical efficiency [1], [4].
Technical Baseline: What is a Near-Eye Display (NED)?
A Near-Eye Display (NED) serves as the optical core of augmented, virtual, and mixed reality (AR/VR/MR) headsets, electronic viewfinders (EVFs), and tactical or medical head-mounted displays (HMDs) [1], [4]. Rather than facilitating direct viewing of a physical emissive panel, an NED uses an optical combiner to form a magnified virtual image positioned in front of the viewer’s eye [2].
Evaluating an NED solution requires a holistic assessment of both the microdisplay light engine and the downstream optical pipeline [2], [5]. Below is an engineering breakdown of the core parameters governing near-eye display performance:
1. Optical & Vision Parameters
These metrics dictate the scale, clarity, and ergonomic comfort of the perceived virtual image [2].
1.1 Field of View (FOV)
- Definition: The angular extent of the virtual image visible to the human eye through the optical system, typically categorized into diagonal, horizontal, and vertical dimensions [2].
- Typical Benchmark Ranges:
- Monocular AR notification smartglasses: 15°- 30° [4]
- AR media/viewing glasses (Birdbath / Waveguide): 40°- 50° [4], [5]
- Immersive VR/MR headsets (Pancake optics): 90°- 110° [3], [4]
- Engineering Insight: A wider FOV increases immersion; however, keeping screen resolution constant while expanding FOV dilutes angular pixel density, causing a degradation in perceived image sharpness [2], [3].
1.2 Pixels Per Degree (PPD)
- Definition: The number of display pixels packed into each degree of the field of view. It is calculated using the formula:

- Benchmark Values:
- Early-generation VR: 10 – 15 PPD (prone to a noticeable “screen-door effect”) [3]
- Current mainstream AR/VR: 30 – 45 PPD [1], [4]
- Retina-grade visual standard: 60 PPD, at which point individual display pixels become imperceptible to the human eye [3].
- Engineering Insight: PPD is the single most critical metric for perceived spatial resolution, offering far greater clinical and technical relevance than raw screen pixel count [2], [3].
1.3 Eyebox (Pupil Motion Range)
- Definition: The maximum 3D spatial region (length × width in mm) within which the user’s pupil can shift without experiencing image vignetting, clipping, or severe optical aberration [2], [5].
- Typical Requirement: At least 8 mm × 8 mm (with 10 mm × 10 mm preferred for ergonomics) [5].
- Engineering Insight: A larger eyebox accommodates variations in facial morphology and interpupillary distance, reducing visual cut-offs during eye movement or head movement [2].
1.4 Eye Relief / Optical Clearance
- Definition: The physical distance from the last optical surface (lens or waveguide combiner) to the vertex of the user’s cornea [2].
- Typical Range: 12 mm- 20 mm [4].
- Engineering Insight: Adequate eye relief is essential to accommodate prescription eyewear without eyelash contact or lens scratching [4].
1.5 Interpupillary Distance (IPD) Adjustment
- Definition: The mechanical or optical range supported by the system to align with the distance between the user’s pupil centers [3].
- Typical Range: 58 mm- 72 mm (covering >95% of the global adult population) [3].
- Engineering Insight: Uncorrected IPD mismatch induces stereoscopic diplopia, asthenopia (eyestrain), and motion sickness. Systems employ stepless mechanical sliders or dynamic digital adjustment [3].
1.6 Diopter Adjustment
- Definition: The integrated optical compensation capacity for myopia or hyperopia [4].
- Typical Range: 0 -6.0 D (accommodating myopia up to 600 degrees) [4].
- Engineering Insight: Built-in diopter correction eliminates the need for insert lenses or wearing glasses inside the HMD [4].
2. Display Panel & Light Engine Parameters
These parameters derive from the microdisplay panel technology (e.g., Micro-OLED, Micro-LED, LCoS) and set the physical baseline for image quality [1], [6].
| Metric Name | Unit / Format | Core Concepts & Technical Standards |
| Display Size | Inches (″) | Active emissive area diagonal. Standard Micro-OLED form factors include 0.23″, 0.39″, 0.55″, 0.71″, and 1.31″ [1], [6]. |
| PPI / Pixel Pitch | PPI / μm | Microdisplay pixel density commonly reaches 3,000- 4,000+ PPI (pixel pitch of 5 – 9μm, essential for high-resolution imaging in compact footprints [1]. |
| Panel Brightness | Nits (cd/㎡) | Native luminance of the display substrate. Micro-OLEDs range from 1,000 – 10,000 nits; inorganic Micro-LEDs reach 100,000- 1,000,000+nits [6]. |
| In-Eye Luminance | Nits (cd/㎡) | The final luminance delivered to the retina [4], [5]. |
| Contrast Ratio | Ratio | Self-emissive Micro-OLEDs achieve >100,000:1 for true blacks; non-emissive technologies (LCD/LCoS) typically range from 1,000:1 – 10,000:1 [1], [6]. |
| Refresh Rate | Hz | Standard targets are 90Hz – 120Hz. High refresh rates eliminate motion blur and suppress vestibular discomfort [3]. |
| Response Time | ms /μs | Microdisplays mandate sub-millisecond response times (Micro-OLED achieves microsecond-level response) to minimize display persistence artifacts [1]. |
| Color Gamut | % sRGB / DCI-P3 | Measures color fidelity. High-end NEDs require >90% DCI-P3 or >100% sRGB coverage [1], [6]. |
3. System & Performance Parameters
3.1 Optical Efficiency / Transmittance
- Concept: The percentage of light energy preserved after traveling through the optical module (e.g., Pancake, Birdbath, Waveguide) [5].
- Architectural Comparison:
- Birdbath Optics: 10%- 12% efficiency [4]
- Pancake Optics (Folded path): 10% – 25% efficiency [4]
- Geometrical / Reflective Waveguides: 10% – 20% efficiency [5]
- Diffractive Waveguides: 1% – 5% efficiency (extremely high photometric loss) [5]
- System Impact: Lower optical efficiency forces the light engine to drive higher power, generating excess heat and draining battery life [1], [5].
3.2 Motion-to-Photon (MTP) Latency
- Definition: The total elapsed time from a user’s physical head or eye movement to the updated frame being fully rendered and projected into the retina [3].
- Target Threshold: Industry consensus sets the maximum acceptable limit at < 20 ms [3].
- System Impact: Latency exceeding 20 ms creates a sensory mismatch between the vestibular system and visual input, causing acute simulator sickness [3].
3.3 Modulation Transfer Function (MTF)
- Definition: A quantitative optical metric evaluating how faithfully the optical system transfers fine detail and contrast from the display source to the image space [2].
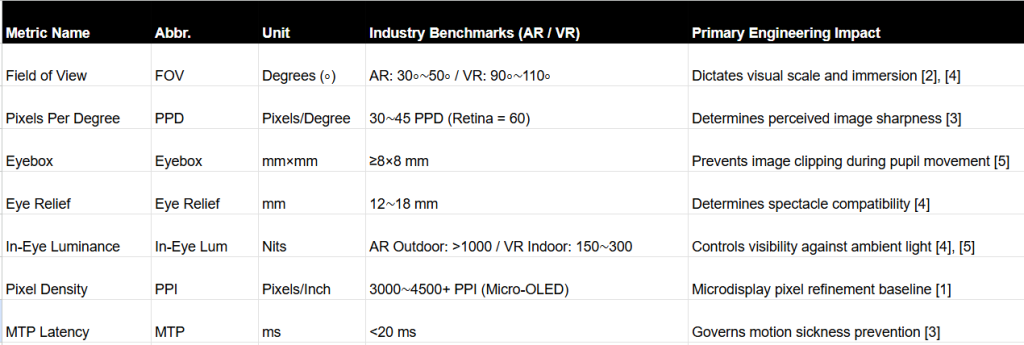
4. Near-Eye Display Core Parameters Reference Table
💡 Engineering Trade-off Note: Near-eye display evaluation requires balancing competing parameters.
- Clarity vs. Immersion: Increasing PPD for sharpness often constrains FOV; expanding FOV dilutes PPD unless spatial panel resolution scales accordingly [2], [3].
- Form Factor vs. Efficiency: Ultra-thin diffractive waveguides and Pancake modules reduce mass but suffer from low optical efficiency, necessitating high-luminance light engines like Micro-OLED or Micro-LED [1], [5].
Authoritative References
[1] Omdia Research. Near Eye Display for XR Application Report & Display Dynamics Tracker, 2024–2026.
[2] IEEE Xplore / IEEE Transactions on Visualization and Computer Graphics. Optical Architectures and Image Quality Metrics for Near-Eye Display Systems, 2024–2025.
[3] Kress, Bernard C. Optical Architectures for Augmented, Virtual, and Mixed Reality Headsets. SPIE Press, 2020/2024.
[4] Society for Information Display (SID) Symposium Digest. Performance Standards for Near-Eye Displays in Augmented and Virtual Reality, 2024–2025.
[5] Journal of the Society for Information Display (JSID). Optical Efficiency and Eyebox Engineering in Waveguide and Pancake Combiners, 2025.
[6] Yole Group. Displays & Optics for AR/VR HMDs Market & Technology Report, 2024–2025.
Technical & Legal Disclaimer
- Informational Purpose: This document is provided strictly for academic analysis, optical engineering evaluation, and technical technology assessment.
- Measurement & Testing Variability: Performance metrics (e.g., PPD, MTF, luminance, efficiency) represent nominal values and theoretical benchmarks under standardized laboratory conditions. Actual performance varies depending on environmental ambient light, optical coatings, driver configurations, and system integration.
- Intellectual Property: All referenced journals, third-party reports, and institutional trademarks belong to their respective copyright holders.